Result
Tap  to display the Result view. A table and a graph show the result. You can try different settings and analyze the measurement result directly in the Display unit.
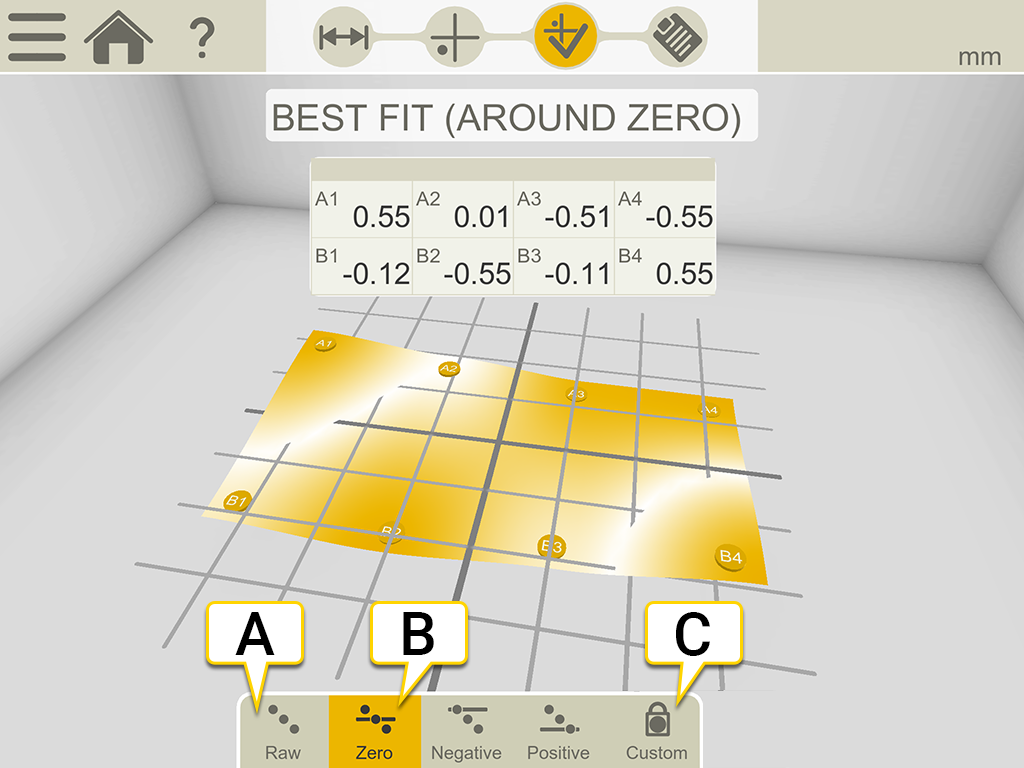
- Raw values.
- "Best fit around zero" is the selected in this example.
- Set custom reference points.
Reference modes
When you perform a best fit calculation, the object is tilted to the lowest peak to peak value. It is fitted as flat as possible between two planes.

|
Raw values. |

|
Zero. When you perform a best fit calculation, the measurement object is tilted to the lowest peak to peak value. It is fitted as flat as possible between two planes where the average value is zero. |

|
Negative. Best fit with all measurement points below 0. The reference line is moved to the highest measurement point. |

|
Positive. Best fit with all measurement points above 0. The reference line is moved to the lowest measurement point. |
Reference points
The measurement values can be recalculated so that any three of them become zero references, with the limitation that a maximum of two of them are in line horizontally or vertically in the coordinate system. (If there are three in line, it is just a line and not a plane!). Reference points are needed when you are going to machine the surface.
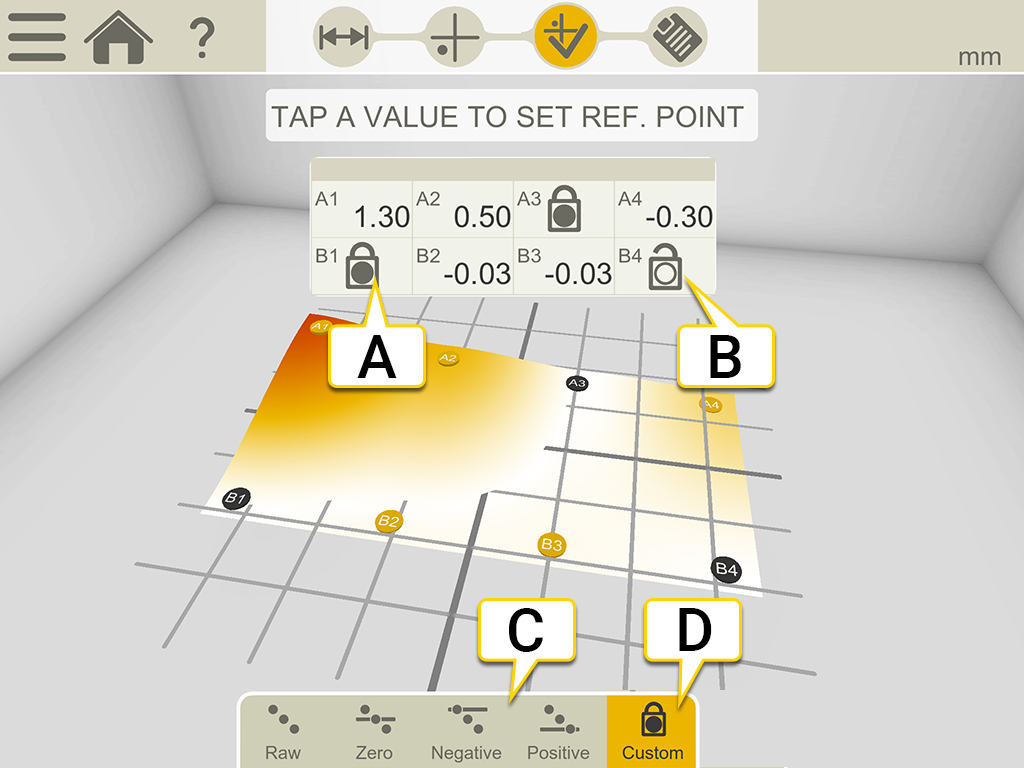
- Reference point.
- Opened reference point.
- Different best fit calculations.
- Set custom reference points is active. By default, a best fit is calculated using global peak to peak.
Set custom reference points
- Tap
 in the table to open a reference point.
 - Tap a value in the table to set it as reference. Maximum two of the reference points can be in line horizontally or vertically.