Result
Tap  to display the Result view. A table or a graph shows the result. You can try different settings and analyze the summary of the measurement result directly in the Display unit before you move on to "Report"
Tap  and
and ![]() to finalize the measurement. The measurement is saved in the File manager.
to finalize the measurement. The measurement is saved in the File manager.
NOTE! As long as you haven´t finalized the result you can return to "Measure" and continue to register values.
View the result as a table
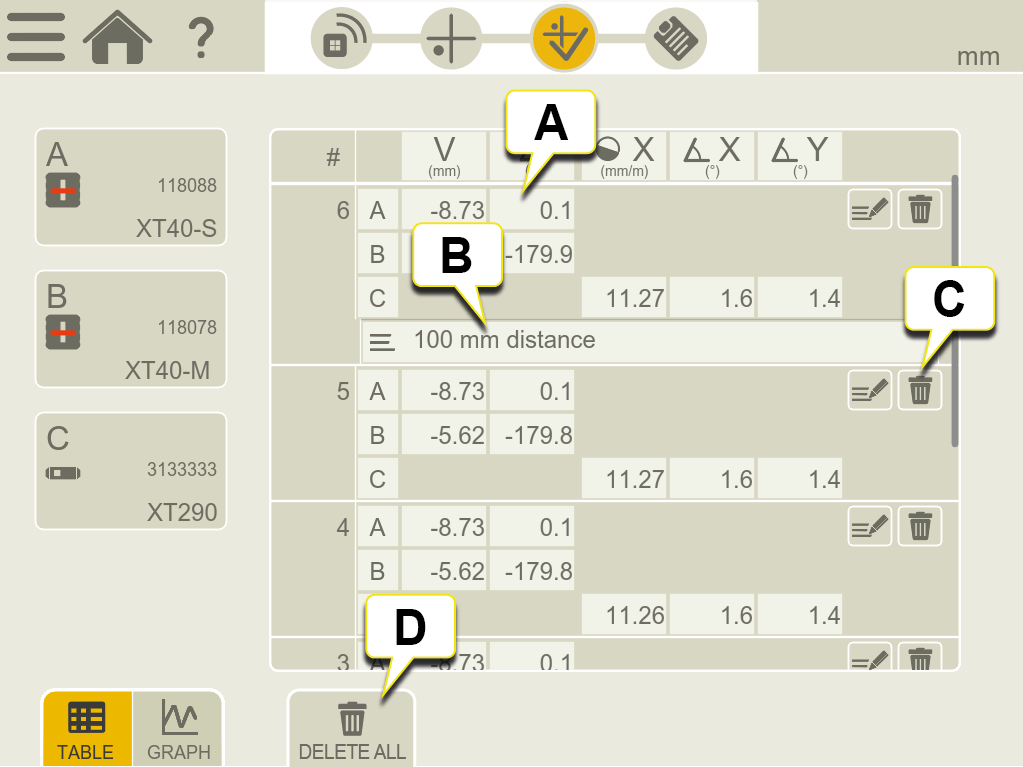
- Measurement results.
- A note has been added.
- Delete measurement instance (not applicable if you have finalized the measurement in "Measure").
- Delete all values (not applicable if you have finalized the measurement in "Measure").
View the result as graphs
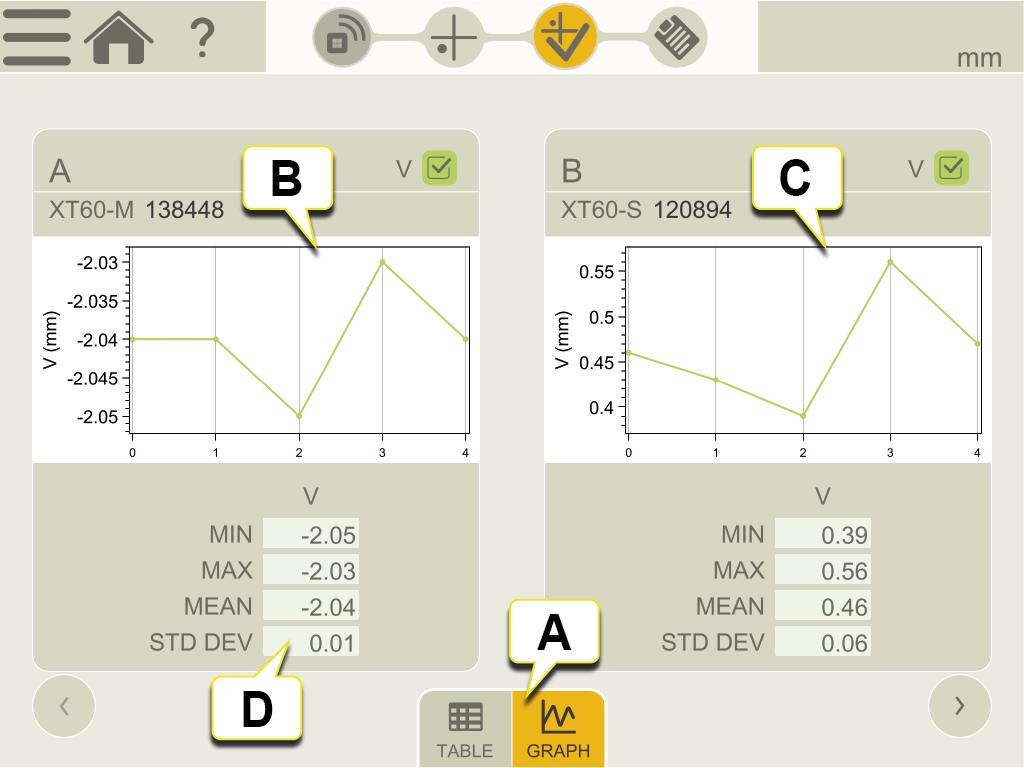
- Toggle between table and graph view.
- Graph showing a visual representation of the measurement data for the chosen measuring unit.
- Graph showing a visual representation of the measurement data for the chosen measuring unit.
- Statistics for the measurement data from the chosen measuring unit.